

Greetings to all my feathered friends upon this fine Memorial Day weekend. Seeing as how you're here, it appears as though we have a lot in common. Namely, we've chosen to spend our three-day weekends on the internet, as opposed to outside.
I've been meaning to build a widget for this very blog for quite some time now. The vision is to embed a custom Kanban board, which would pull issues from our private JIRA instance to be publicly displayed and formatted to our liking. To my knowledge, nobody has bothered to attempt building something like this yet; probably for good reason. There are a few gotchas off the bat: for one, JIRA cloud's REST API has introduced a "bug" which disallows cross-domain calls. Fine.
My frustration with propriety software has come down to this: we're going to use two highly-protected closed source behemoth products against one another. Here's the plan:
- Pull JIRA issues into Tableau
- Format the data in a worksheet
- Output our data to a MongoDB database
- Build a Kanban widget to display these issues
- Hack the shit out of both JIRA and Tableau to make this process automated
If this seems like a convoluted way of achieving a small goal, it absolutely is - the goal is just as much to become familiar with these systems as is the end prize. There's a lot going on here, so for part 1 let's do a dry run of getting our issues from JIRA to MongoDB.
The Extraction
Pulling all issues from JIRA would normally be a simple API call, but in the spirit of learning new things we'll try out JIRA's Tableau connector. This essentially enables an endpoint specifically for Tableau to pull JIRA data from. After installing the JIRA add-on, we'll be able to produce a URL for Tableau to consume via the Web Data Connector source:

The connector allows us to select the data we're looking to pull from JIRA upfront. Keep our scope in mind: we're looking to simply display a "card" (think Trello for all you noobs out there) per issue, so we're only concerned with the information we'd need to build that. I've boiled this down to:
- Key
- Issue Type
- Summary
- Description
- Status
- Creator
- Priority
- Epic link
- Epic Name
- Epic Color

Work That Sheet
With our data imported, create a new worksheet. If you've used Tableau before you're probably very aware of the default column limit on Worksheets. Before we do anything, go to Analysis > Table Layout > Advanced to increase the max columns from 6 to whatever, let's say 12.

Drag your data into the "rows" shelf to get something like this:
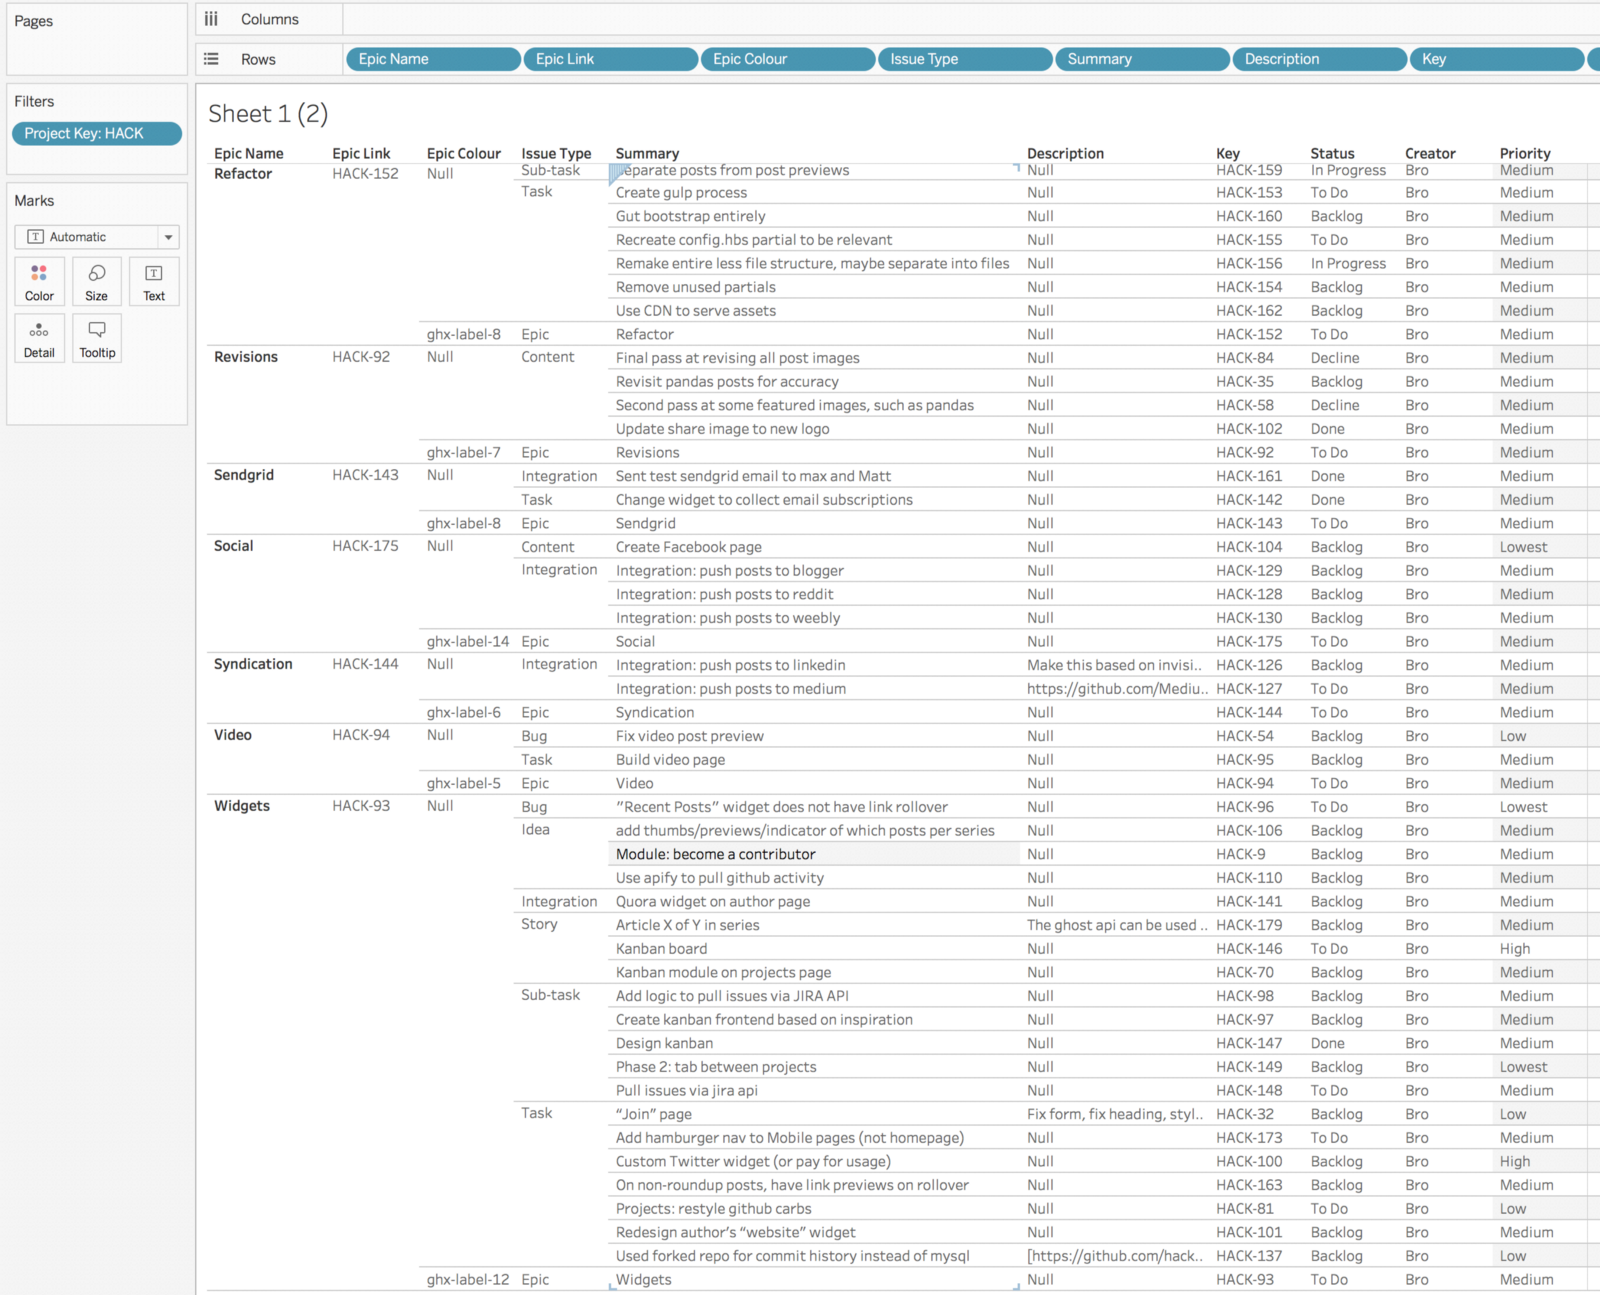
There are a few problems here we need to clean up. First, take a look at the "Epic Color" column.
Eyes as Blue as ghx-label-7
For some reason, JIRA finds it appropriate to label its colors this cryptic code of ghx-label-#. Go ahead and add this to the long list of shitty decisions Atlassian has chosen to pursue.
Keeping our goal in mind, we need "epic colors" to add some style and flavor to our board. Could we make the board without this? Probably, if you're a quitter. I'm going to save you some time here. I went ahead and inspected the epic elements in my JIRA instance to extract their hex values. Create a new calculated field and add this query to manually map the label nonsense to actual values:
IF [Epic Colour] = "ghx-label-1"
THEN "#42526E"
ELSEIF [Epic Colour] = "ghx-label-2"
THEN "#FFC400"
ELSEIF [Epic Colour] = "ghx-label-3"
THEN "#FFE380"
ELSEIF [Epic Colour] = "ghx-label-4"
THEN "#4C9AFF"
ELSEIF [Epic Colour] = "ghx-label-5"
THEN "#00C7E6"
ELSEIF [Epic Colour] = "ghx-label-6"
THEN "#79F2C0"
ELSEIF [Epic Colour] = "ghx-label-7"
THEN "#C0B6F2"
ELSEIF [Epic Colour] = "ghx-label-8"
THEN "#998DD9"
ELSEIF [Epic Colour] = "ghx-label-9"
THEN "#FFBDAD"
ELSEIF [Epic Colour] = "ghx-label-10"
THEN "#B3D4FF"
ELSEIF [Epic Colour] = "ghx-label-11"
THEN "#79E2F2"
ELSEIF [Epic Colour] = "ghx-label-12"
THEN "#EBECF0"
ELSEIF [Epic Colour] = "ghx-label-13"
THEN "#57D9A3"
ELSEIF [Epic Colour] = "ghx-label-14"
THEN "#FF8F73"
ELSEIF [Epic Colour] = "ghx-label-15"
THEN "#57D9A3"
ELSEIF [Epic Colour] = "ghx-label-16"
THEN "#57D9A3"
ELSEIF [Epic Colour] = "ghx-label-17"
THEN "#57D9A3"
END
Replace the "Epic Color" field with this new calculated field to reveal our next problem.
Epic Lynx
If you check out our sheet now, we'll see the proper colors values come through, but they will only be appearing for what seems to be one issue per "Epic" in our sheet:

Feel free to moan and groan a bit while we realize what's happening. We're looking at a list of issues here, where epics are themselves to be considered an issue. Therefore, only issues which are epics will have colors: issues which are linked to said epics, however, will not. This is annoying. It took me a bit to come up with the following solution, although I'd be curious to hear if anybody has a better way of doing this.
Go ahead and create a new worksheet. Add Epic Link and Epic Color to the sheet, and filter out the null values:

So here's the game plan. Stay with me on this one: we're going to use this sheet as a new source to perform a join with our original data. Once we join on Epic Link, every issue containing an epic link will have the parent color as a field as well.
Export this data as a CSV. Go back to Data Sources, open a new data source, and select the CSV we just created. Create an inner merge and associate by epic link:

Now we're getting somewhere. Go back to the original sheet and drag the color field from the new data source on to the shelf:

Pro move. Calculated.
Mondo Bongo
You'll notice I switched the order of our rows around to have "Issue key" as the first column. Originally I made the mistake of not doing this, only to realize that Tableau will not export merged cells into a CSV. We need to order our columns starting with the most unique first to avoid any cell merging.
Export that bad boy.
This is where we'll import our data into MongoDB. How dope is MongoDB, you ask? Well, one feature is the ability to import a CSV into an empty database to automatically create the resulting schema and populate it with your values. Yeah, it's that sick.
I won't turn this into a MongoDB tutorial. Setting up a MongoDB Atlas cluster is somewhat straightforward, and we can use the MongoDB Compass client to simply import the CSV we created.

What Next?
As mentioned, our first take at this is going to be a dry run of building this widget with our initial data import. We'll be building this widget in an ExpressJS app, so next we'll focus on how to connect our app to MongoDB and extract this data.
After that, we'll need to find a way to automate this process moving forward. Full disclosure: Tableau most definitely will not play nice with this, and I'm iffy on how possible this is. All I know is I've got a Tableau Server instance up and running, and I paid good money for it. Therefore, it is my right to break it.
I hope at least one or two people have found this to be helpful or interesting thus far. Again, I realize this process is a completely roundabout way of accomplishing this task... this is mostly a way for us to learn the ins-and-outs of these systems. Perhaps we might even build something special. Just think: if we manage to close the loop on this system, we can leverage a GUI to create apps nearly as fast as we can imagine them.