

Let's face it: the last thing the world needs is another "Intro to Pandas" post. Anybody strange enough to read this blog surely had the same reaction to discovering Pandas as I did: a manic euphoria that can only be described as love at first sight. We wanted to tell the world, and that we did... a lot. Yet here I am, about to helplessly sing cliche praises one more time.
I’m a prisoner of circumstance here. As it turns out, the vast (and I mean vast) majority of our fans have a raging Pandas addiction. They come to our humble mom-and-pop shop here at Hackers and Slackers foaming at the mouth, going on raging benders for all Pandas-related content. If I had half a brain, I’d rename this site Pandas and Pandas and delete all non-Pandas-related content. Talk about cash money.
As a middle-ground, I’ve decided to do a bit of housekeeping. My previous “Intro to Pandas” post was an unflattering belligerent mess jotted into a Confluence instance long ago during a Friday night pregame. That mess snuck its way onto this blog and has gone unnoticed for a year now. I've decided this probably wasn't the best way to open up a series about the most influential Python library ever. We're going to try this again; For the Pandas.
Intro to Pandas Rereleased: in IMAX 8k 4D
Pandasever is used to analyze and modify tabular data in Python. When we say “tabular data,” we mean any instance in life where data is represented in a table format. Excel, SQL databases, shitty HTML tables.... they’ve all been the same thing with different syntax this whole time. Pandas can achieve anything that any other table can.
If you’re reasonably green to data analysis and are experiencing the “oh-my-God-all-data-professions-are-kinda-just-Excel” realization as we speak, feel free to take a moment. Great, that’s behind us now.
The Anatomy of a DataFrame
Tabular data in Pandas is referred to as a DataFrame. We can’t call everything “tables-” otherwise, our choice of vague terminology would grow horribly confusing when we refer to data in different systems. Between you and me DataFrames are basically tables.
So how do we represent two-dimensional data via command line: a concept that inherently interprets and displays information one-dimensionally?
DataFrames consist of individual parts that are easy to understand at face value. The complexity of these things together, creating a sum more significant than the whole of its parts, fuels the seemingly endless power of DataFrames. If we want any hope of contributing to the field of data science, we need to understand the terminology and at least be aware of core concepts of what a DataFrame is beneath the hood. This understanding is what separates engineers from Excel monkeys.
Parts of a DataFrame
Were you expecting this post just to be a bunch of one-liners in Pandas? Good, I hope you're disappointed. Strap yourself in: we might learn something today. Let's break apart what makes a DataFrame piece-by-piece:
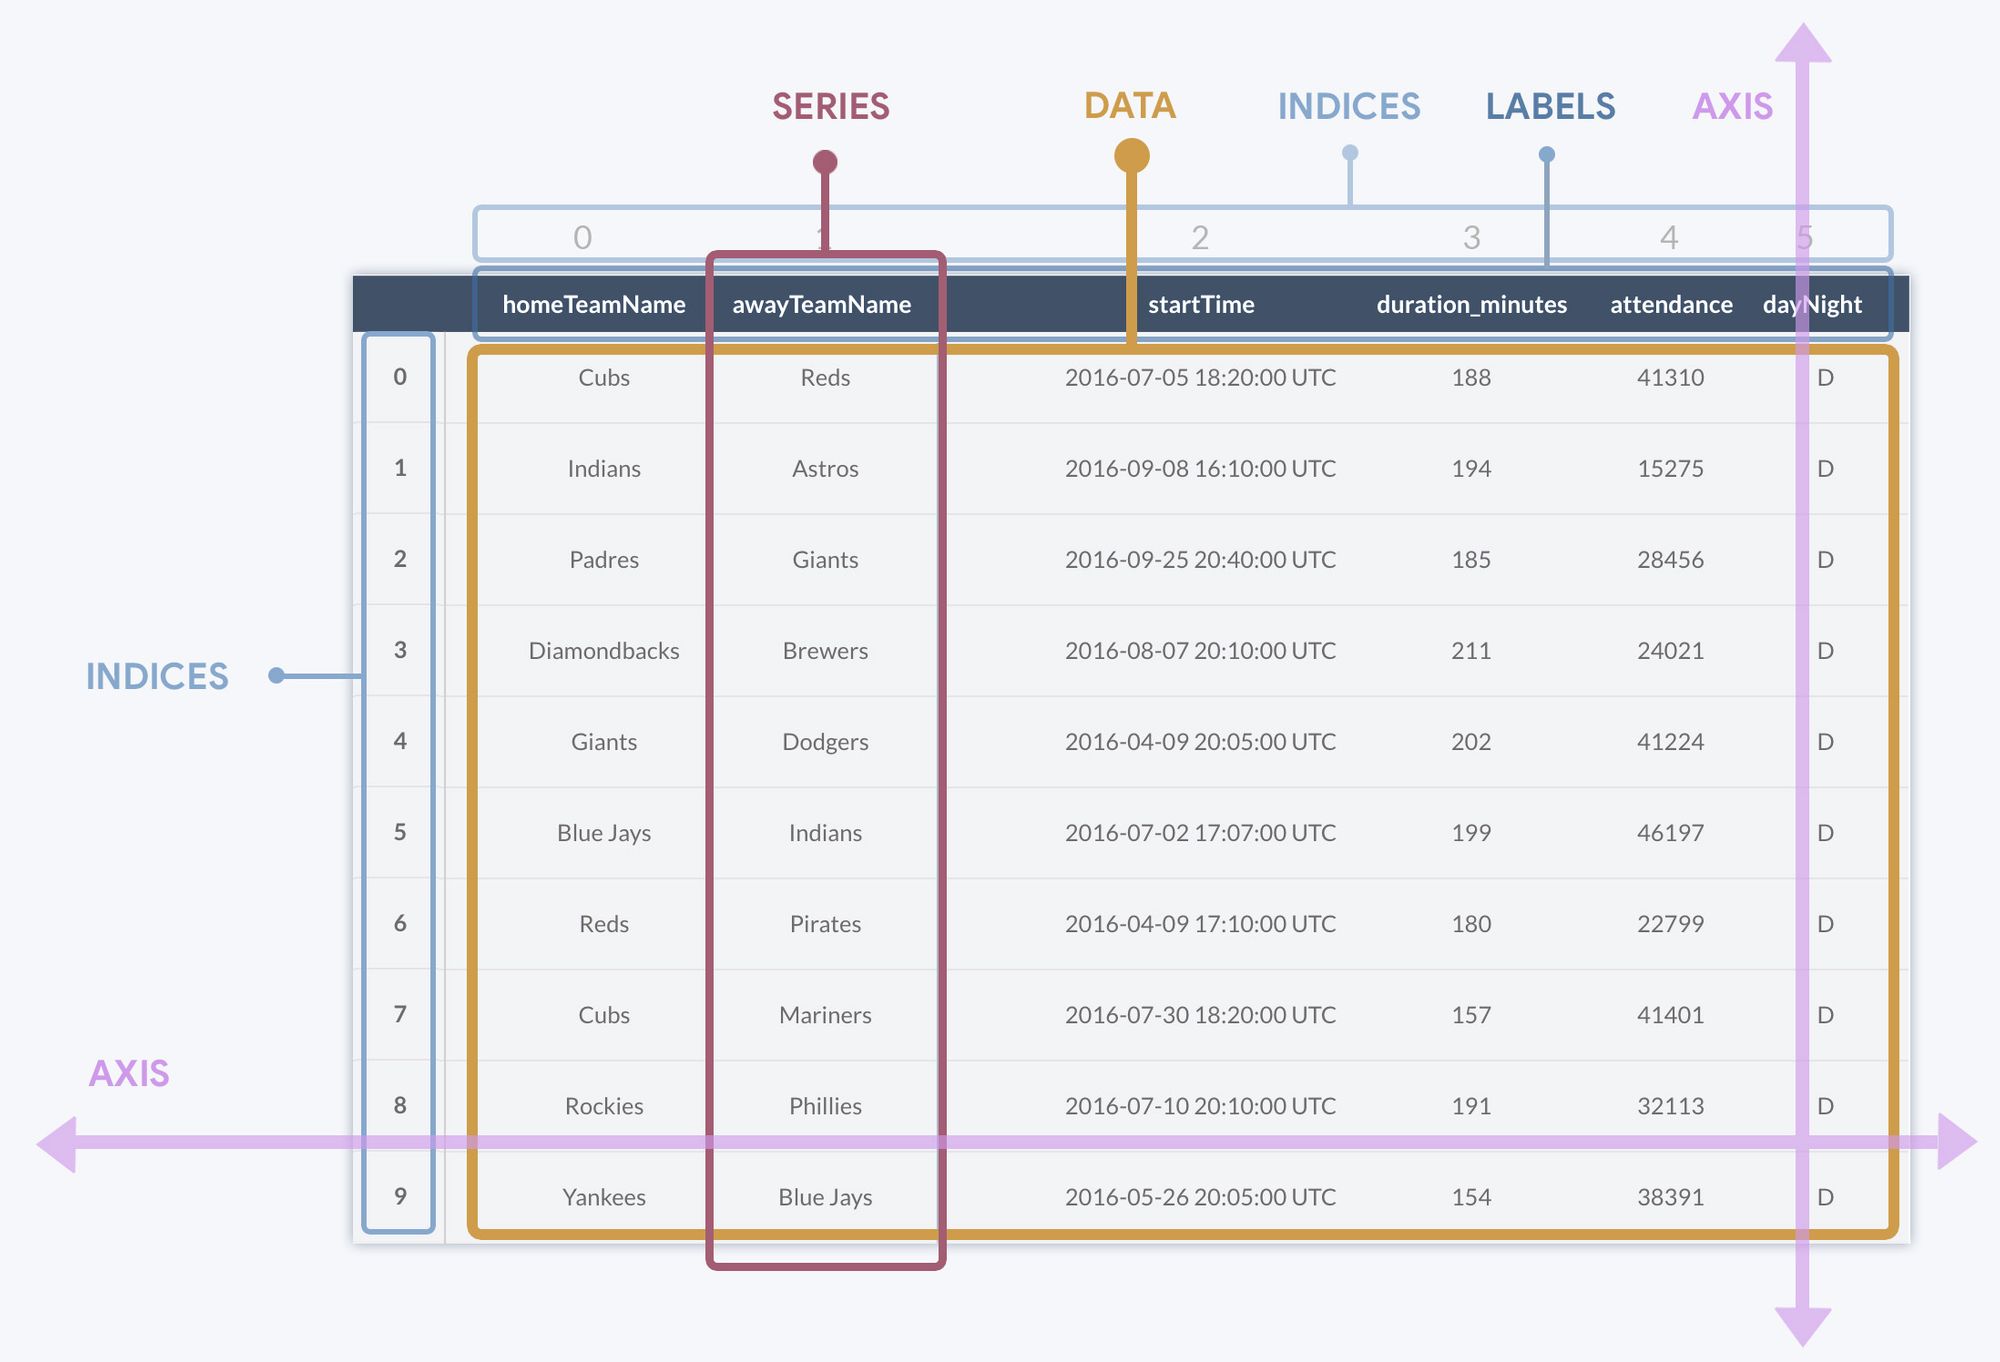
DataFrameThe most basic description of any table would be a collection of columns and rows. Despite looking at a two-dimensional grid, columns are very different from rows. Unlike rows, all data in a column typically abides by the same data type. In the above example, any value saved in the startTime column will always be a time. Rows, on the other hand, are simply an entry- an instance of a "thing," where each thing is described by attributes stored horizontally across columns.
This seems like elementary stuff, but I mention it for a reason. By definition, columns are more pivotal to structuring a table than rows because even empty columns have meaning. In contrast, an empty row with no columns will always equal infinite nothingness. Rows are made up of values in columns, not vice versa. Thus, columns in Pandas are actually their own type of object called a Series.
Series' are objects native toPandas(andNumpy), which refer to one-dimensional data sequences. Another example of a one-dimensional data sequence could be an array, but series' are much more than arrays: they're a class of their own for many powerful reasons, which we'll see in a moment.- Axis refers to the 'direction' of a series, or in other words, "column" or "row." A
Serieswith an axis of0is a row, whereas a series with an axis of1is a column. - A
Seriescontains labels, which are given visual names for a row/column specifying labels. This allows us to call upon any labeledSeriesas we would access a value in a Python dictionary. For instance, accessingdataframe['awayTeamName']returns the entire column matching the header "awayTeamName." - Every row and column has a numerical index. Most of the time, a row's label will be equivalent to the row's index. While it's common practice to define column headers, columns also have indexes, which aren't displayed unless explicitly so. In this regard,
Seriesshare an attribute with lists and arrays in that they are a collection of indexed values.
Consider the last two points: we just described a Series to work the same way as a Python Dict, but also the same way as a Python List. That's right: Series objects are like the biracial offspring of lists and Dict. We can access any column by name or index; the same goes for rows. Even if we rip a column out from a DataFrame, each cell in that Series will retain the row labels for every cell. This means we can say things like get me column #3, and then find me the value for whatever was in the row labeled "Y". Of course, this works in reverse as well. It's crazy how things get exponentially more powerful and complicated when we add entire dimensions, isn't it?
Loading Data Into Pandas
If you've made it this far, you've earned the right to start getting hands-on. Luckily, Pandas has plenty of methods to load tabular data into DataFrames, regardless of whether you're using static files, SQL, or quirkier methods. Pandas has you covered. Here are some of my favorite examples:
import pandas as pd

# Reads a local CSV file.
csv_df = pd.read_csv('data.csv')

# Similar to above
excel_df = pd.read_excel('data.xlsx')

# Creating tabular data from non-tabular JSON
json_df = pd.read_json('data.json')

# Direct db access utilizing SQLAlchemy
read_sql = read_sql('SELECT * FROM blah', conn=sqlalchemy_engine)

# My personal ridiculous favorite: HTML table to DataFrame.
read_html = read_html('examplePageWithTable.html')

# The strength of Google BigQuery: already officially supported by Pandas
read_gbq = read_gbq('SELECT * FROM test_dataset.test_table', projectid)
Load data into Pandas
All of these achieve the same result when creating a DataFrame. No matter what horrible data sources you may have been forced to inherit, Pandas is here to help. Pandas knows our pain. Pandas is love. Pandas is life.
With data loaded, let's see how we can apply our new knowledge of Series to interact with our data.
Finding Data in Our DataFrame
Pandas has a method for finding a Series by label and a separate method for finding a series by index. These methods are .iloc and .loc, respectively. Let's say our DataFrame from the example above is stored as a variable named baseball_df. To get the values of a column by name, we would do the following:
team_names = baseball_df.iloc['homeTeamName']

print(team_names)
Get a Series by label
This would return the following:
0   Cubs
1   Indians
2   Padres
3   Diamondbacks
4   Giants
5   Blue Jays
6   Reds
7   Cubs
8   Rockies
9   Yankees
Name: homeTeamName, dtype: object
That's our column! We can see the row labels being listed alongside each row's value. Told ya so. Getting a column will also return the column's dtype, or data type. Data types can be set explicitly in columns. If they aren't, Pandas will generally either default to detecting that the data in the column is a float (returned for any column which only holds numerical values, despite the number of decimal points) or an 'object,' which is a fancy catch-all meaning "fuck if I know, there's letters and shit in there, it could be anything probably." Pandas doesn't try hard on its own to discern the types of data in each field.
If you're thinking ahead, you might see a looming conflict of interest with iloc. Since we've established that columns and rows are the same, and we're accessing series' based on criteria that are met by both columns and rows (every table has a first row and a first column), how does Pandas know what we want with .loc()? Short answer: It doesn't, so it just returns both!
baseball_df = baseball_df.loc[3]

print(baseball_df)
Here's the output:
    homeTeamName    awayTeamName   startTime      duration_minutes
0   Cubs            Reds           18:20:00 UTC   188
1   Indians         Astros         18:20:00 UTC   194
2   Padres          Giants         18:20:00 UTC   185
3   Diamondbacks    Brewers        18:20:00 UTC   211
Fetching data via loc() returns n number of rows and columns
Ahhh, a 4x4 grid! This does satisfy what we asked for, albeit in a clever, intentional way. In fact, "Clever and intentional" would be a great tagline to describe the Pandas library. This combination of ease and power makes Pandas so magnetic to curious newcomers.
Want another example? How about leveraging the unique attributes of series' to splice DataFrames as though they were arrays?
sliced_df = df.loc['homeTeamName':'awayTeamName']

print(sliced_df)
Here's the output:
    homeTeamName    awayTeamName
0   Cubs            Reds
1   Indians         Astros
2   Padres          Giants
3   Diamondbacks    Brewers
...Did we just do that? We totally did. Thanks to the power of the Series object, we could slice a two-dimensional data set using the same syntax that we'd used to slice arrays.
Welcome to the Club
There are many more entertaining, mind-blowing ways to introduce people to Pandas. If our goal had been sheer amusement, we would have leveraged the cookie-cutter route to Pandas tutorials: overloading readers with Pandas "tricks" display immense power in minimal effort. Unfortunately, we took the applicable approach to actually retaining information. Surely this model of "informational and time-consuming" will beat out "useless but instantly gratifying," right? RIGHT?
Whatever. I’ll schedule the Pandas and Pandas rebrand for next week. From now on, when people want that quick fix, you can call me Pablo Escobar. Join us next time when we use Pandas data analysis to determine which private Caribbean island offers the best return on investment with all the filthy money we’ll make.
Hint: it’s definitely not the Fyre Festival one.