

Now that we're comfortable with Spark DataFrames, we're going to implement this newfound knowledge to help us implement a streaming data pipeline in PySpark. As it turns out, real-time data streaming is one of Spark's greatest strengths.
For this go-around, we'll touch on the basics of how to build a structured stream in Spark. Databricks has a few sweet features which help us visualize streaming data: we'll be using these features to validate whether or not our stream worked. If you're looking to hook Spark into a message broker or create a production-ready pipeline, we'll be covering this in a future post.
Preparing Some Data
We're going to need some reasonably real-looking data to get going here. Keeping in spirit with the nature of data streams (and overhyped technology trends), I've generated a set of data meant to mimic input from IoT devices. We're going to dive into structured streaming by exploring the very-real scenario of IoT devices streaming event actions to a centralized location.
The nature of this data is 20 different JSON files, where each file has 1000 entries. This collection of files should serve as a pretty good emulation of what real data might look like. If you'd like to get your hands on these files, I've uploaded them here. Let's get a preview:
[{
    "time": "2018-10-27T16:52:04Z",
    "customer": "Feliks Fuggle",
    "action": "power on",
    "device": "Footbot Air Quality Monitor"
  },
  {
    "time": "2019-04-05T10:56:05Z",
    "customer": "Chelsea Redgewell",
    "action": "power off",
    "device": "Amazon Echo"
  },
  {
    "time": "2018-06-22T04:29:44Z",
    "customer": "Cymbre Bischof",
    "action": "low battery",
    "device": "Nest T3021US Thermostat"
  },
  {
    "time": "2019-01-28T07:36:33Z",
    "customer": "Bettye McKeefry",
    "action": "low battery",
    "device": "August Doorbell Cam"
  },
  {
    "time": "2019-04-21T23:33:44Z",
    "customer": "Gratiana Shapera",
    "action": "power on",
    "device": "Nest T3021US Thermostat"
  },
  {
    "time": "2018-06-20T08:18:21Z",
    "customer": "Hurleigh Gotcliff",
    "action": "low battery",
    "device": "Amazon Echo"
  },
...
DISCLAIMER: This data is not real (I've actually compiled it using Mockaroo, which is a great one-stop shop for creating fake datasets). Our data will look completely random as a result (because it is).
We're going to build a structured stream that looks at a location where all these files are uploaded and streams the data.
Uploading Our Data
As much as I want to upload this data to S3, Amazon has locked me out of my own account. They've been locked me out for months, prompting me for a CVV for a credit card I no longer have (AWS support does nothing). If anybody knows somebody at Amazon, hit me up.
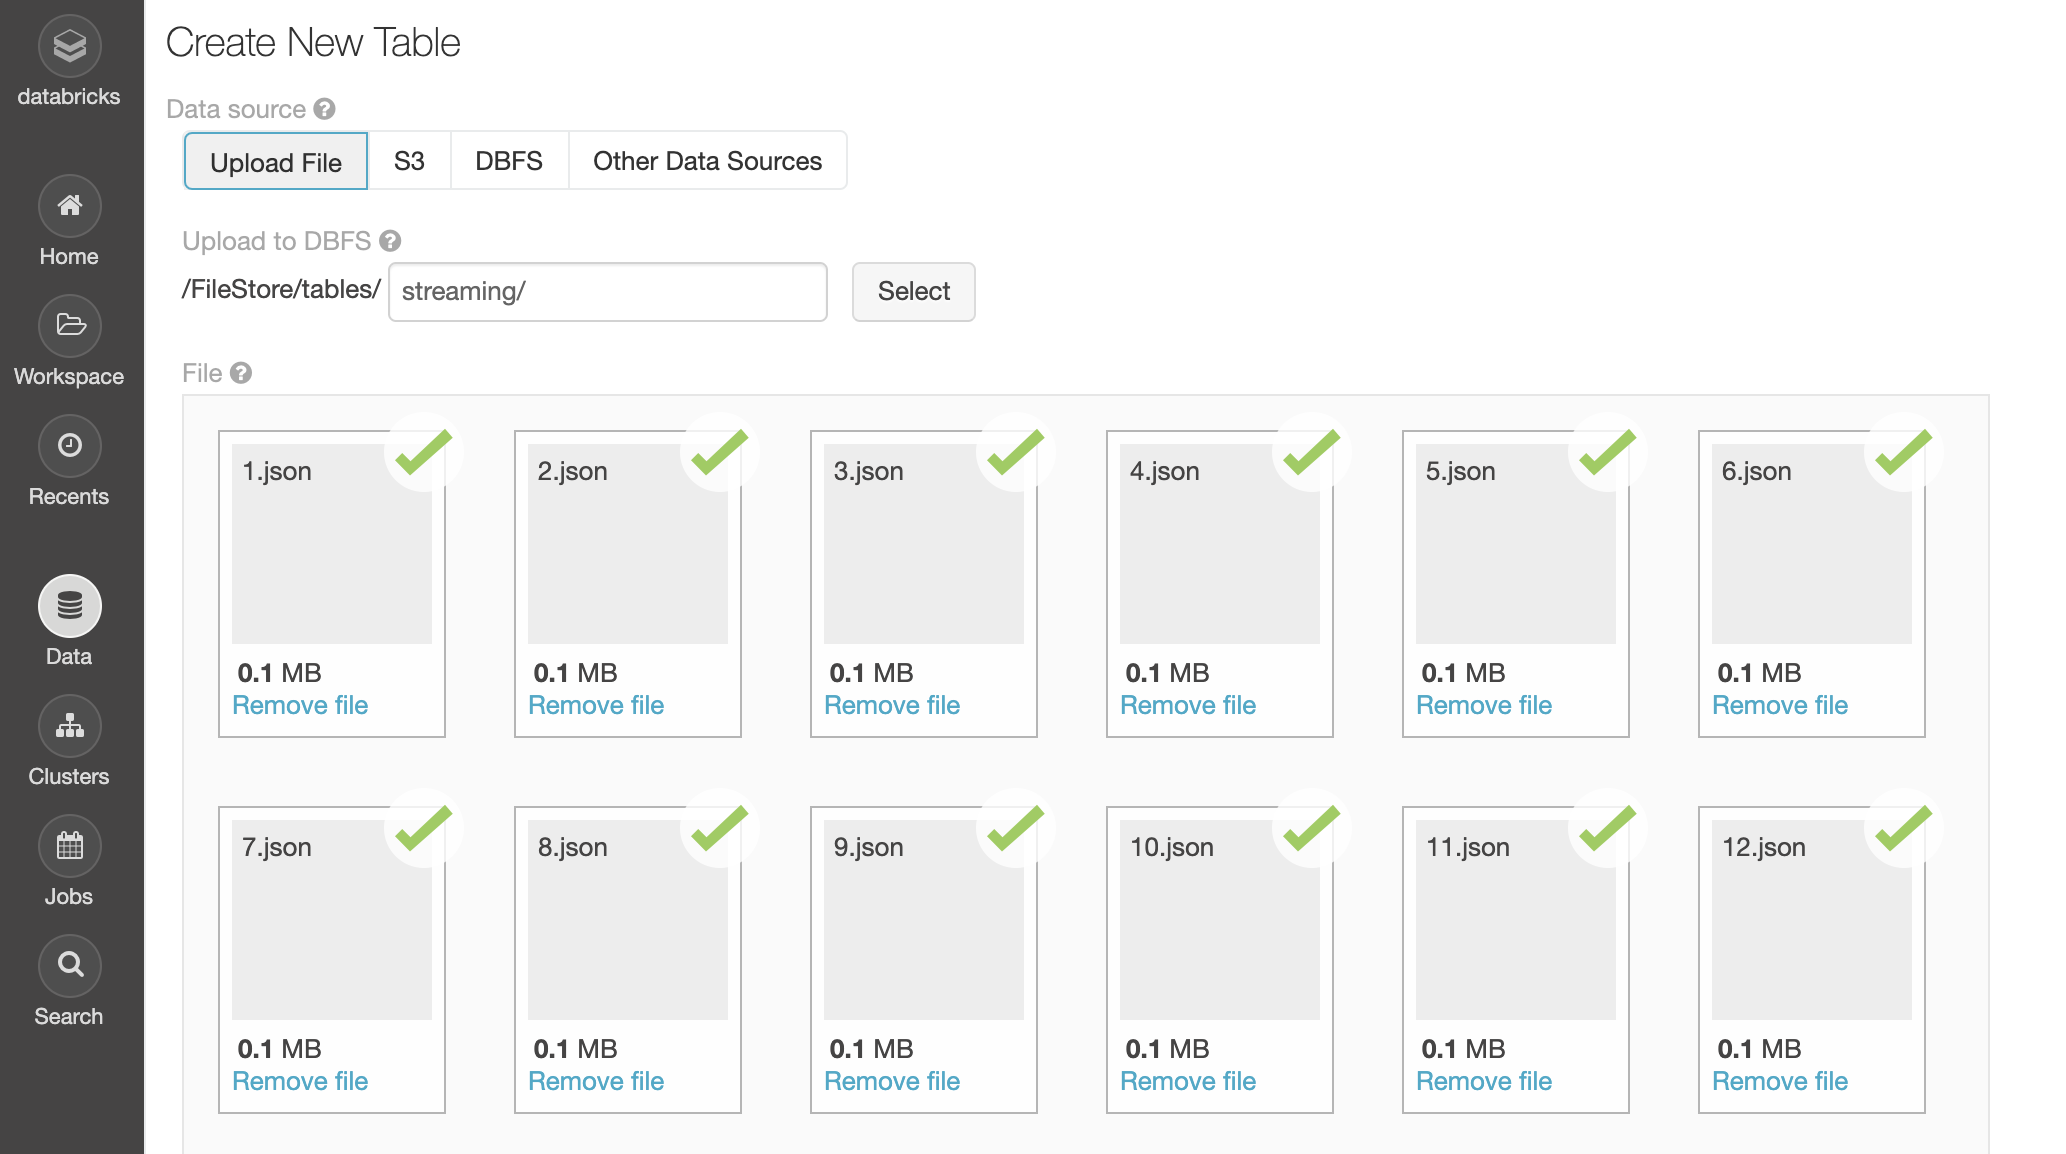
Instead, we'll host these files in our Databricks account, which is easily handled in the UI of the data tab. After starting a cluster, I'll simply upload these 20 JSON files and store them in DBFS (Databricks file system). The path I'm using is /FileStore/tables/streaming/.
We can verify that the data has been uploaded by browsing DBFS:
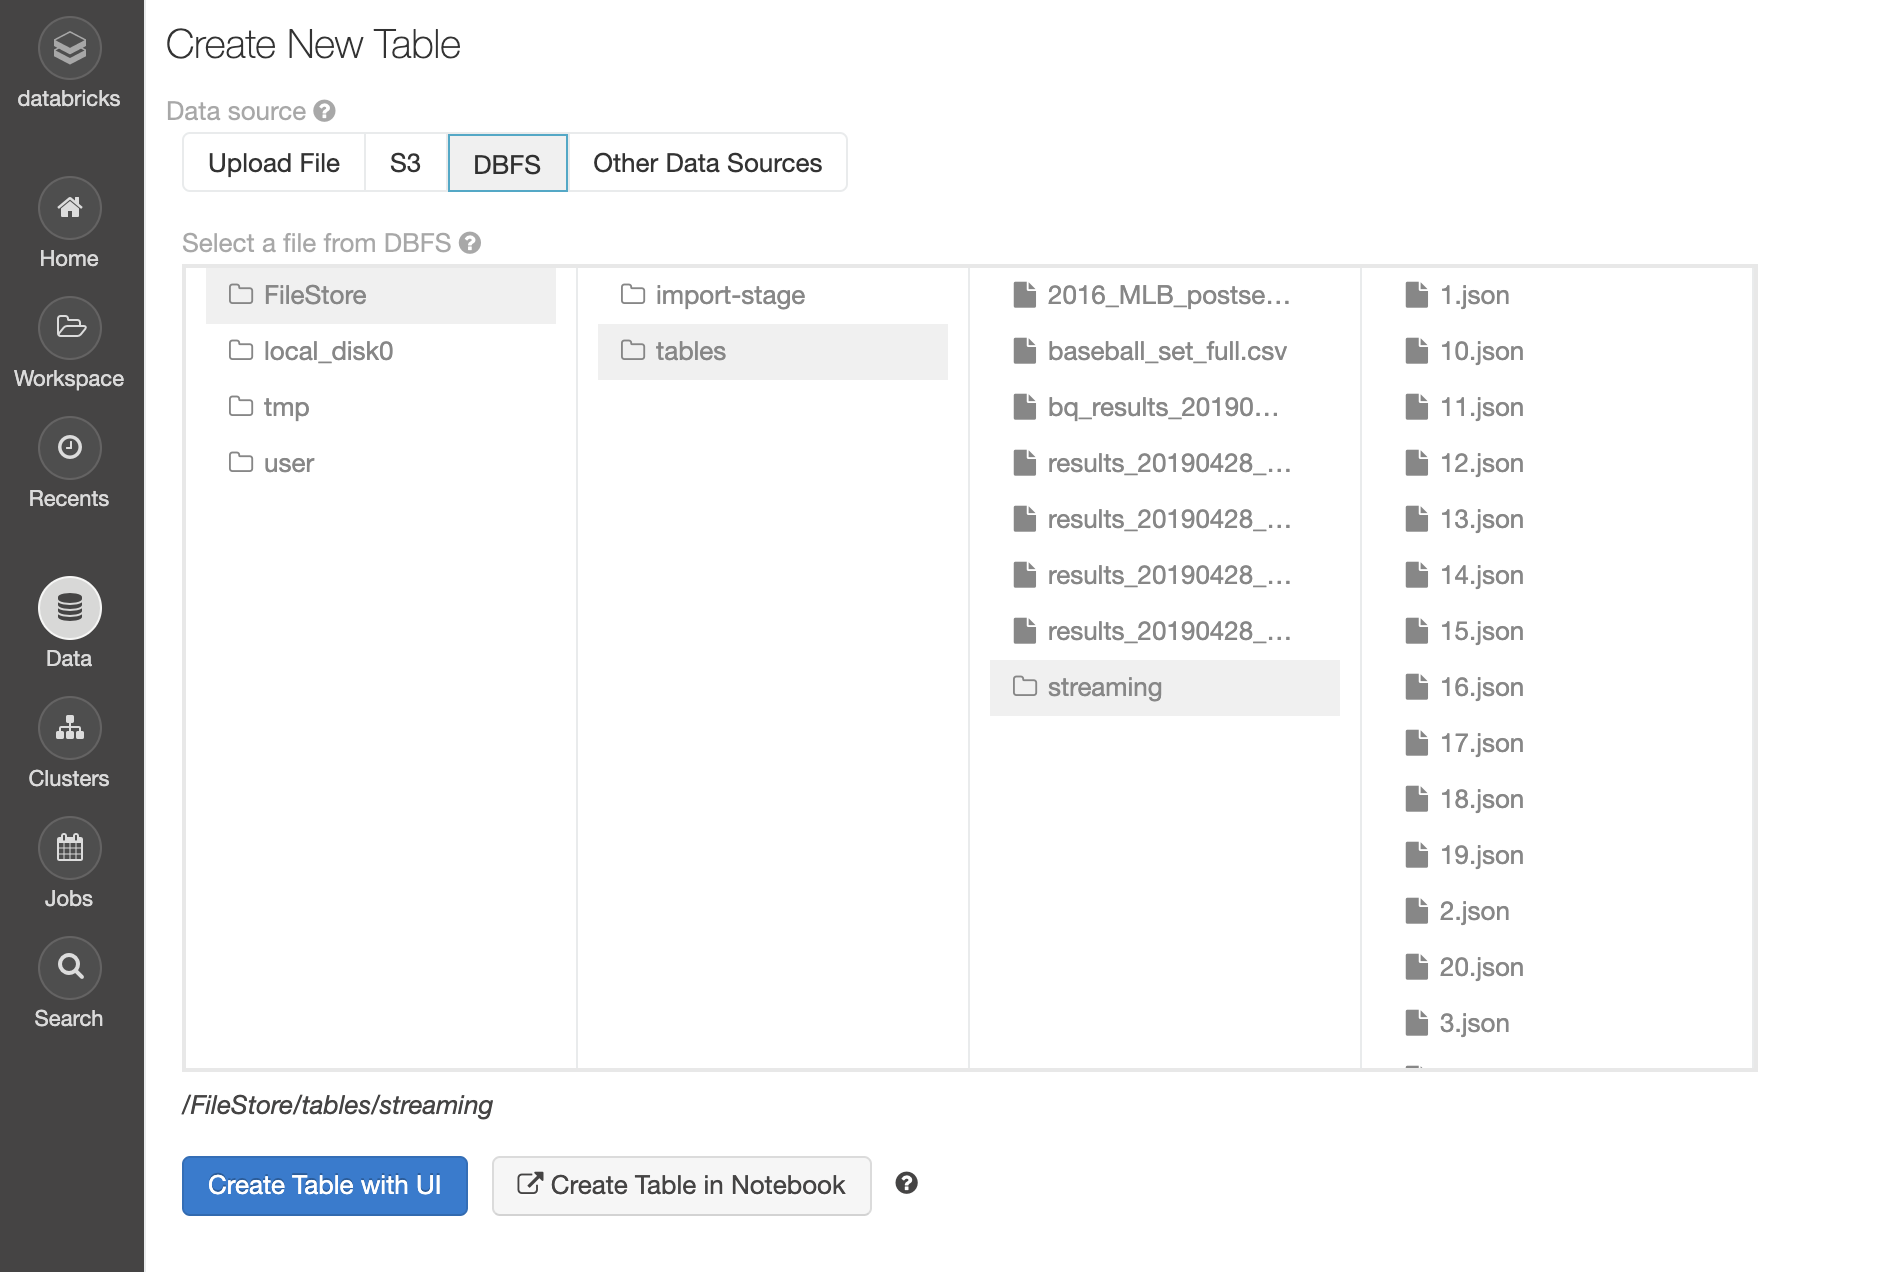
Looks like we're good to go.
dbfs rm -r dbfs:/FileStore/tables/[folder_name]/.Loading and Inspecting Our Data
We start off by importing the timestamp and string types; we know we'll need to support these types from looking at our data earlier. Then we save the path to our data to the variable inputPath:
from pyspark.sql.types import TimestampType, StringType

# Path to our 20 JSON files
inputPath = "/FileStore/tables/streaming/"
We'll create a schema for our data; it's generally a bad idea to infer schema when creating a structured stream. We're streaming data from one predictable source to another, thus we should explicitly to set our data structure (and eliminate the chance of this being set incorrectly).
# Explicitly set schema
schema = StructType(
    [
        StructField("time", TimestampType(), True),
        StructField("customer", StringType(), True),
        StructField("action", StringType(), True),
        StructField("device", StringType(), True)
    ]
)
Explicitly define a schema for loaded JSON
StructType is a reserved word that allows us to create a schema made of StructFields. StructField accepts 3 parameters: the name of our field, the type, and whether or not the field should be nullable.
Let's use all of this to create a DataFrame:
from pyspark.sql.types import TimestampType, StringType, StructType, StructField


# Path to our 20 JSON files
inputPath = "/FileStore/tables/streaming/"

# Explicitly set schema
schema = StructType(
    [
        StructField("time", TimestampType(), True),
        StructField("customer", StringType(), True),
        StructField("action", StringType(), True),
        StructField("device", StringType(), True)
    ]
)

# Create DataFrame representing data in the JSON files
inputDF = (
  spark
    .read
    .schema(schema)
    .json(inputPath)
)

display(inputDF)
Create DataFrame from JSON
Here's our output:
| time | customer | action | device |
|---|---|---|---|
| null | null | null | null |
| 2018-06-05T01:33:35.000+0000 | Sharia Cromack | low battery | August Doorbell Cam |
| 2019-01-08T17:03:51.000+0000 | Rosemary Rickford | low battery | Amazon Dash Button |
| 2019-04-26T14:45:54.000+0000 | Kessia Deeming | power off | Nest T3021US Thermostat |
| 2018-07-24T12:49:36.000+0000 | Carver McCook | power off | Amazon Echo |
| 2018-08-24T09:00:57.000+0000 | Anet Eagles | power on | August Doorbell Cam |
| 2018-09-24T07:06:01.000+0000 | Rolando Momery | power on | Amazon Echo |
| 2018-08-22T09:20:51.000+0000 | Tore Littleover | power on | August Doorbell Cam |
| 2018-08-13T13:23:27.000+0000 | Randa Ainsley | power off | August Doorbell Cam |
| 2018-06-05T20:40:33.000+0000 | Mayor Bratty | power on | Amazon Echo |
A wild empty row appears! It seems as though our attempts to emulate a real-world scenario are going well: we already have our first dumb problem! No worries:
# Remove empty rows
inputDF = inputDF.dropna()

display(inputDF)
Remove rows with empty values
That'll do it. Let's investigate our data further by taking a look at the distribution of actions amongst our IOT devices. We'll do this by creating a new DataFrame with an aggregate function: grouping by action:
# Aggregate number of actions
actionsDF = (
  inputDF
    .groupBy(
       inputDF.action
    )
    .count()
)
actionsDF.cache()

# Create temp table named 'iot_action_counts'
actionsDF.createOrReplaceTempView("iot_action_counts")
Perform a groupBy aggregate function
Now we can query the table we just created:
%sql

SELECT action, SUM(count) AS total_count FROM iot_action_counts GROUP BY action;
Check it out:
| action | total_count |
|---|---|
| power on | 6631 |
| low battery | 6733 |
| power off | 6616 |
Sweet! Nothing unexpected here. Let's start streaming, shall we?
Streaming Our Data
To load data into a streaming DataFrame, we create a DataFrame just how we did with inputDF with one key difference: instead of .read, we'll be using .readStream:
# Create streaming equivalent of `inputDF` using .readStream
streamingDF = (
  spark
    .readStream
    .schema(schema)
    .option("maxFilesPerTrigger", 1)
    .json(inputPath)
)
That's right, creating a streaming DataFrame is as simple as the flick of this switch.
Our data isn't being created in real-time, so we'll have to use a trick to emulate streaming conditions. Instead of streaming data as it comes in, we can load each of our JSON files one at a time. That's what option() is doing: we're setting the maxFilesPerTrigger option to 1, which means only a single JSON file will be streamed at a time. This will allow us to see the data as it streams in!
Another cool thing we can do is create a DataFrame from streamingDF with some transformations applied, like the aggregate we had earlier. This DataFrame will stream as it inherits readStream from the parent:
# Create streaming equivalent of `inputDF` using .readStream()
streamingDF = (
  spark
    .readStream
    .schema(schema)
    .option("maxFilesPerTrigger", 1)
    .json(inputPath)
)

# Stream `streamingDF` while aggregating by action
streamingActionCountsDF = (
  streamingDF
    .groupBy(
      streamingDF.action
    )
    .count()
)
Stream aggregated DataFrame
DataFrames have a built-in check for when we quickly need to test our stream's status. Running .isStreaming on a DataFrame will return a Boolean value, which will tell us whether or not the DataFrame is streaming:
# Is `streamingActionCountsDF` streaming?

streamingActionCountsDF.isStreaming
Check if DataFrame is streaming
The output:
TrueStarting our Stream
Now we have a streaming DataFrame, but it isn't streaming anywhere. To stream to a destination, we need to call writeStream() on our DataFrame and set all the necessary options:
spark.conf.set("spark.sql.shuffle.partitions", "2")

# View stream in real-time
query = (
  streamingActionCountsDF
    .writeStream
    .format("memory")
    .queryName("counts")
    .outputMode("complete")
    .start()
)
Start streaming a PySpark DataFrame
Here's a quick breakdown:
Format
We can call .format() on a DataFrame which is streaming writes to specify the type of destination our data will be written to. Each type of output is called an output sink (get it? Because we're streaming into a sink). .format() accepts the following:
- parquet: Stores the output to a directory. Requires the path option to be set, which sets the destination of the file.
- kafka: Stores the output to one or more topics in Kafka. Required options are kafka.bootstrap.servers (list of Kafka server IP addresses) and topic (Kafka topic or topics to write to).
- console: Prints the output to the console/stdout every time there is a trigger. Used for debugging.
- memory: The output is stored in memory as an in-memory table. Requires that
.queryName()be set. Used for debugging.
We're just testing this out, so writing our DataFrame to memory works for us. If this were writing somewhere real, we'd want to point to a message broker or what-have-you.
Output Mode
.outputMode() is used to determine the data to be written to a streaming sink. The "output" specifically refers to any time there is new data available in a streaming DataFrame. .outputMode() accepts any of three values:
- append: Only new rows will be written to the sink.
- complete: All rows will be written to the sink every time there are updates.
- update: Only the rows that were updated will be written to the sink, every time there are updates.
Start
Starts a stream of data when called on a streaming DataFrame.
Watching Data Stream Live in Databricks
How do we preview data being streamed to memory? Databricks has a dope way of seeing how streams are performing in real time, while still in our notebook. Check out what happens when we run a cell that contains the above:
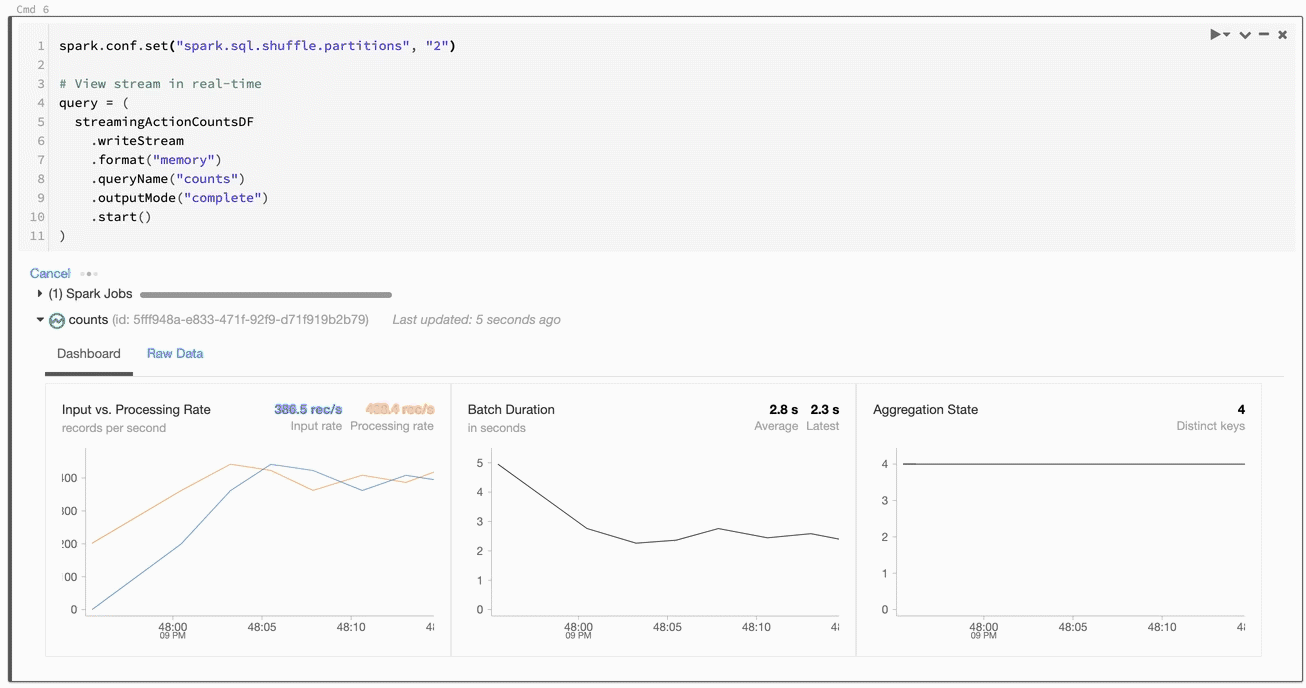
Things are happening! We're shown useful information about the processing rate, batch duration, and so forth. Really cool stuff. If we switch to the raw data tab, we can see exactly what's happening:
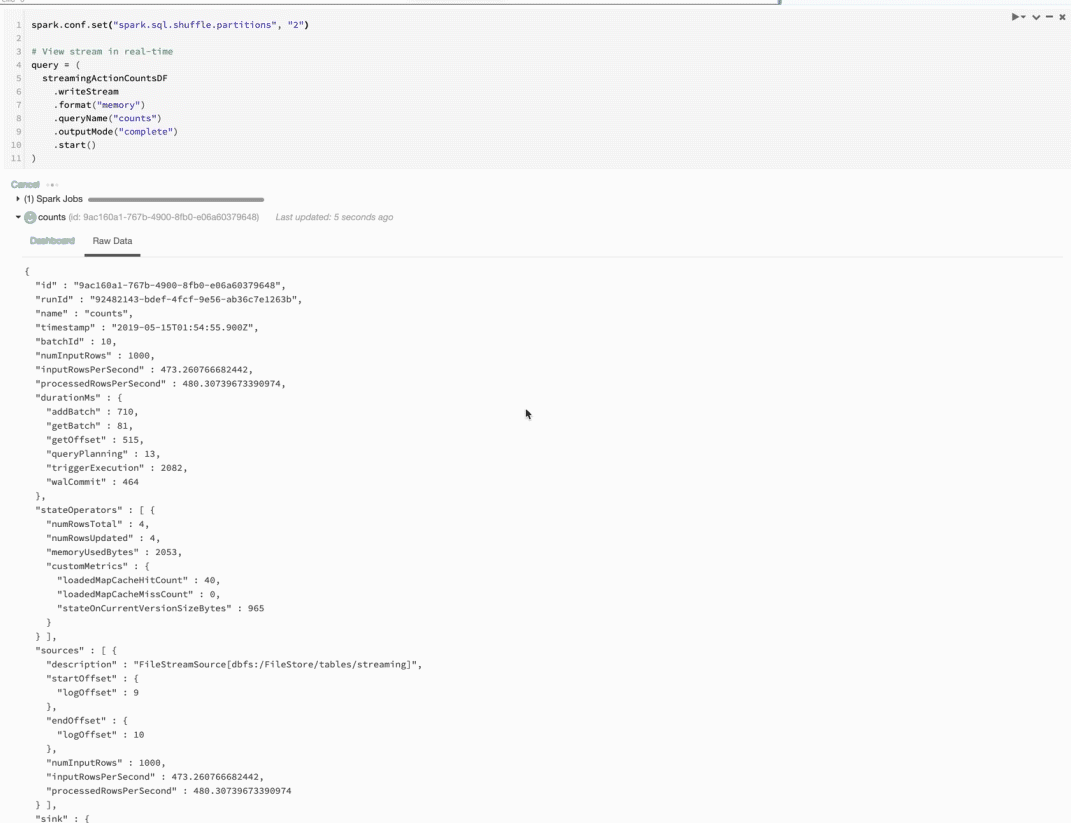
Now we're talking! Check out the value for batchId... notice how it ticks up to 20 and then stops? That's one per JSON file! We're also shown things like the timestamp, numInoutRows, and other useful stuff.
Well, we did it. When all is said and done, building structured streams with PySpark isn't as daunting as it sounds. Until next time, space cowboy.