

If you've been here before, you probably already know our affinity for Mapbox and the visualization tools it provides data scientists and analysts. In the past, we've covered encoding location data from raw addresses, as well as an exploration of Mapbox Studio for those getting acquainted with the tool. Today we're going a step further: drawing directions on a map.
It sounds simple enough: we already know how to geocode addresses, so all we need to do is literally go from point A to point B. That said, things always tend to get tricky, and if you've never worked with GeoJSON before, you're in for a treat.
Load Up Some Data
I'm going to assume you have a DataFrame ready containing these columns:
- origin_longitude
- origin_latitude
- destination_longitude
- destination_latitude
- Name/description of this route
If you want to play along, there are plenty of free datasets out there to play with - I sourced some information from BigQuery while I was testing things out.
import os
import pandas as pd
import requests
import json

routes_df = pd.read_csv('datasources/routes.csv').head(10)
token = os.environ.get('mapbox_token')
So far so good- all we've done is load our data, and save our Mapbox token from an environment variable.
Mapbox Directions Endpoint
Next, we're going to use Mapbox's Directions API to return a route for us. The anatomy of a GET call to receive directions looks like this:
https://api.mapbox.com/directions/v5/mapbox/{{method_of_transportation}}/{{origin_longitude}},{{origin_latitude}};{{destination_longitude}},{{destination_latitude}}

PARAMS:
access_token={{your_mapbox_access_token}}
geometries=geojson
- method_of_transportation refers to one of the three methods that Mapbox offers for creating routes: driving-traffic, driving, walking, and cycling. Note that there is currently no way to draw route objects which follow public transit: this is perhaps Mapbox's biggest downfall at the moment. Nevertheless, if this is something you need, data can be imported from Google maps to be used with Mapbox.
- access_token can be either your public token (visible upon login at mapbox.com) or a generated secret token.
- geometries accepts the method by which to draw the object. This can be GeoJSON, polyline, or polyline6. Let's stick with GeoJSON.
Constructing API Requests
Let's construct a request per row in our DataFrame. By using Pandas' apply, we fire a function per row to do just that:
import os
import pandas as pd
import requests
import json

routes_df = pd.read_csv('datasources/routes.csv').head(10)
token = os.environ.get('mapbox_token')

def create_route_json(row):
    """Get route JSON."""
    base_url = 'https://api.mapbox.com/directions/v5/mapbox/driving/'
    url = base_url + str(row['home_longitude']) + \
        ',' + str(row['home_latitude']) + \
        ';' + str(row['destination_longitude']) + \
        ',' + str(row['destination_latitude'])
    params = {
        'geometries': 'geojson',
        'access_token': token
    }
    req = requests.get(url, params=params)
    route_json = req.json()['routes'][0]
    # Now what?


routes_df.apply(create_route_json, axis=1)
Here's where things get a little tricky. You see, GeoJSON abides by a strict format. It looks something like this:
{
  "type": "Feature",
  "geometry": {
    "coordinates": [
      [ -73.985897, 40.748133 ], [ -73.985046, 40.747773 ],
      [ -73.984579, 40.748431 ], [ -73.973437, 40.743885 ],
      [ -73.972844, 40.744452 ], [ -73.970728, 40.743885 ],
      [ -73.970611, 40.735137 ], [ -73.9714, 40.733734 ],
      [ -73.973503, 40.732341 ], [ -73.969823, 40.729864 ],
      [ -73.969243, 40.727535 ], [ -73.975074, 40.711418 ],
      [ -73.976603, 40.710276 ], [ -73.978077, 40.710587 ],
      [ -73.979462, 40.70932 ], [ -73.992664, 40.708145 ],
      [ -73.996237, 40.707307 ], [ -74.001135, 40.704086 ],
      [ -74.0055, 40.70243 ], [ -74.006778, 40.703628 ],
      [ -74.009173, 40.702484 ], [ -74.010637, 40.70371 ],
      [ -74.014535, 40.703624 ], [ -74.014665, 40.704034 ],
      [ -74.017057, 40.703259 ]
    ],
    "type": "LineString"
  },
  "legs": [{
      "summary": "",
      "weight": 3873.3,
      "duration": 3873.3,
      "steps": [],
      "distance": 9660.2
  }],
  "weight_name": "duration",
  "weight": 3873.3,
  "duration": 3873.3,
  "distance": 9660.2,
  "properties": {
    "name": "Empire State"
  }
}
For the sake of being difficult, the Mapbox Directions API doesn't return responses in exactly this format. Instead, their response looks like this:
{
  "routes": [{
    "geometry": {
      "coordinates": [
        [-73.985897, 40.748133],
        [-73.985046, 40.747773],
        [-73.984579, 40.748431],
        [-73.973437, 40.743885],
        [-73.972844, 40.744452],
        [-73.970728, 40.743885],
        [-73.970611, 40.735137],
        [-73.9714, 40.733734],
        [-73.973503, 40.732341],
        [-73.969823, 40.729864],
        [-73.969243, 40.727535],
        [-73.975074, 40.711418],
        [-73.976603, 40.710276],
        [-73.978077, 40.710587],
        [-73.979462, 40.70932],
        [-73.992664, 40.708145],
        [-73.996237, 40.707307],
        [-74.001135, 40.704086],
        [-74.0055, 40.70243],
        [-74.006778, 40.703628],
        [-74.009173, 40.702484],
        [-74.010637, 40.70371],
        [-74.014535, 40.703624],
        [-74.014665, 40.704034],
        [-74.017057, 40.703259]
      ],
      "type": "LineString"
    },
    "legs": [{
      "summary": "",
      "weight": 3873.3,
      "duration": 3873.3,
      "steps": [],
      "distance": 9660.2
    }],
    "weight_name": "duration",
    "weight": 3873.3,
    "duration": 3873.3,
    "distance": 9660.2
  }],
  "waypoints": [{
      "distance": 34.00158252003884,
      "name": "West 33rd Street",
      "location": [
        -73.985897,
        40.748133
      ]
    },
    {
      "distance": 6.627227256764976,
      "name": "",
      "location": [
        -74.017057,
        40.703259
      ]
    }
  ],
  "code": "Ok",
  "uuid": "cjsomodyl025642o6f1jsddx6"
}
The format isn't too far off, but it's different enough to not work.
Formatting GeoJSON Correctly
We need to write a function to take the response Mapbox has given us and transform it into a usable GeoJSON format:
import os
import pandas as pd
import requests
import json

routes_df = pd.read_csv('datasources/routes.csv').head(10)
token = os.environ.get('mapbox_token')


def create_route_geojson(route_json, name):
    """Properly formats GeoJson for Mapbox visualization."""
    routes_dict = {
        "type": "Feature",
        "geometry": {
            "type": "LineString"
        },
        "weight_name": "duration",
        "weight": 718.9,
        "duration": 0,
        "distance": 0,
        "properties": {
            "name": ""
        }
    }
    routes_dict['geometry']['coordinates'] = route_json['geometry']['coordinates']
    routes_dict['legs'] = route_json['legs']
    routes_dict['duration'] = route_json['legs'][0]['duration']
    routes_dict['distance'] = route_json['legs'][0]['distance']
    routes_dict['properties']['name'] = name
    with open('dataoutput/' + name + '.json', 'w') as f:
        json.dump(routes_dict,
                  f,
                  sort_keys=True,
                  indent=4,
                  ensure_ascii=False)


def create_walking_route(row):
    """Get route JSON."""
    base_url = 'https://api.mapbox.com/directions/v5/mapbox/driving/'
    url = base_url + str(row['home_longitude']) + \
        ',' + str(row['home_latitude']) + \
        ';' + str(row['destination_longitude']) + \
        ',' + str(row['destination_latitude'])
    params = {
        'geometries': 'geojson',
        'access_token': token
    }
    req = requests.get(url, params=params)
    route_json = req.json()['routes'][0]
    create_route_geojson(route_json, str(int(row['route_id'])))


routes_df.apply(create_walking_route, axis=1)
It's not pretty, but it's reliable: we explicitly create the JSON structure we need with routes_dict, and modify it with the API responses coming back from Mapbox. Of course, we're still doing this one at a time, for every row in our DataFrame.
You'll notice I save each JSON file locally for now. In the future, we'll write a script to automate the process of uploading our GeoJSON objects and adding them to the proper Tilesets, but right now I just want to see that our work paid off!
By using Mapbox studio, we can see the result of our first route:
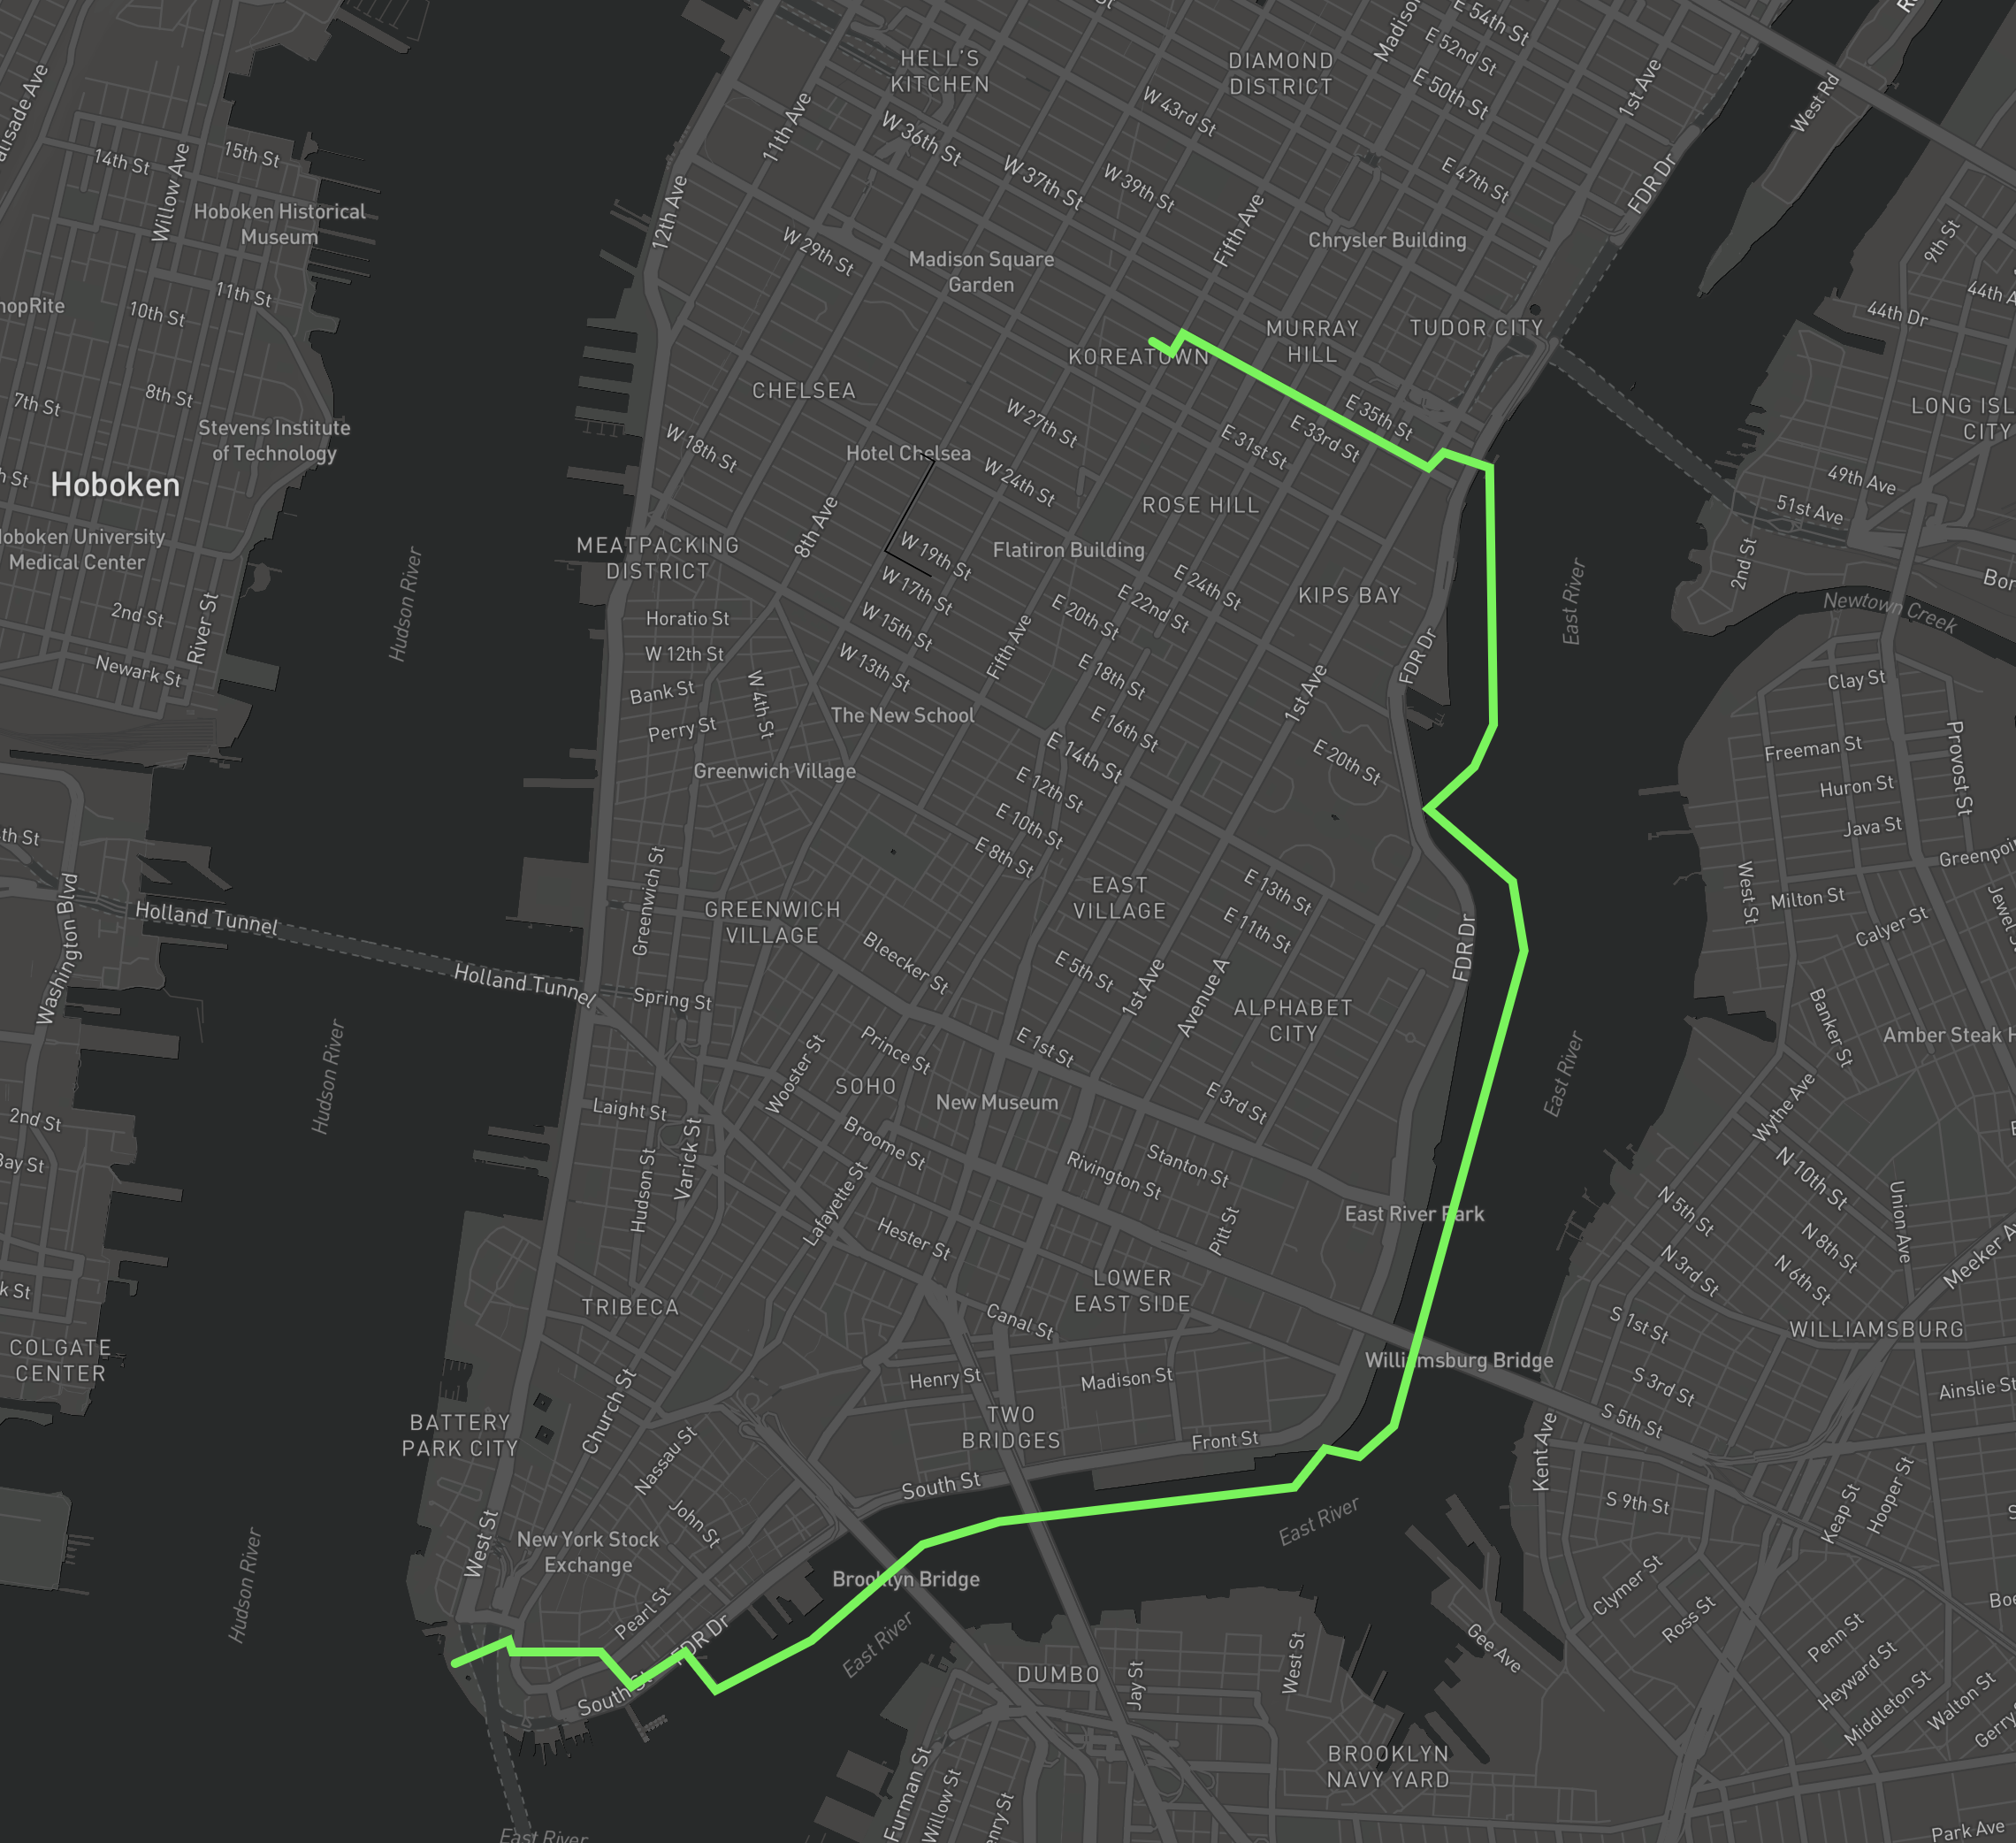
Aha! Would you look at that- Mapbox knew to take the FDR drive. That's some promising stuff.
Drawing Routes En Masse
Naturally, this is only the tip of the iceberg. Of the DataFrame of information we loaded up, we've so far only viewed a single result. If anything in data is worth doing, it must be done thousands of times systematically without fail. Luckily, Mapbox provides us with the tools to do this: from lending us an S3 bucket, to modifying datasets via the API, there's nothing to fear.
Tune in next time when do more... uhh, stuff!